The Bullish Tri-Star candlestick pattern is a rare and powerful three-candlestick pattern in technical analysis that signals a strong potential bullish reversal. This pattern typically occurs at the end of a downtrend and suggests a significant shift from a bearish (downward) trend to a bullish (upward) one. The Bullish Tri-Star pattern is formed by three small candlesticks, with the middle candlestick having a lower close than the preceding and succeeding candlesticks. The color of the candlesticks is not as important as their relative positions and shapes. This pattern primarily focuses on the open, high, low, and close prices of the candlesticks, rather than their color.
Here are the key characteristics and interpretations of the Bullish Tri-Star pattern:
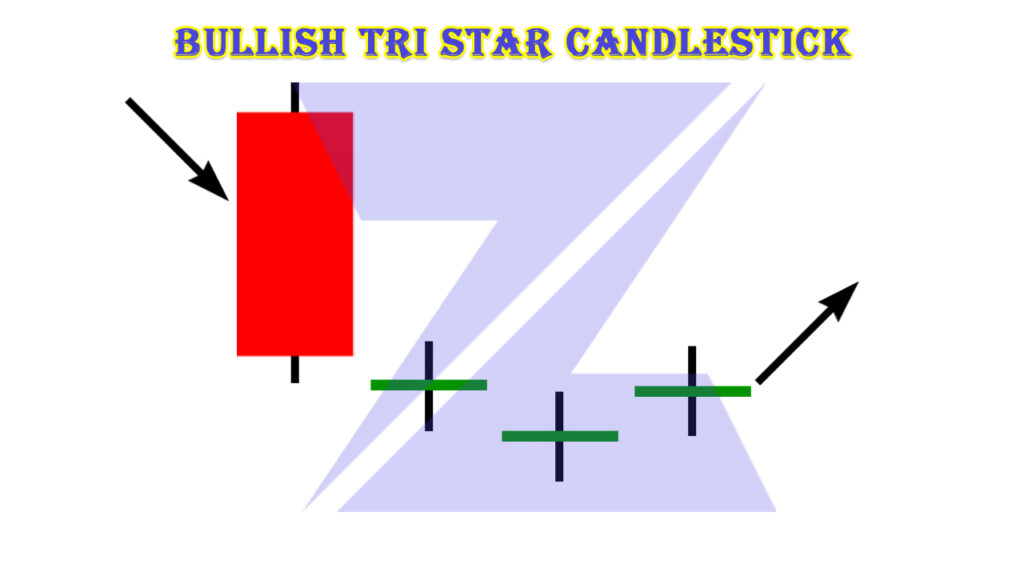
Characteristics of a Bullish Tri-Star Candlestick Pattern:
The Bullish Tri-Star pattern consists of three key candles:
- First Candle (Small): The pattern starts with a small bearish (downward) candlestick, which represents the existing downtrend. This candle often has a small real body and small trading range.
- Second Candle (Small and Doji): The second candle is also small and often forms a doji, indicating market indecision. It has a small real body and a narrow trading range, and it opens and closes very close to the same level.
- Third Candle (Small): The third candle is another small candlestick, but this time it’s bullish (upward). Like the previous two candles, it has a small real body and a narrow trading range.
The key to identifying the Bullish Tri-Star pattern is the fact that the middle candle (the doji) has a lower close than both the preceding and succeeding candles.
Interpretation of a Bullish Tri-Star Candlestick Pattern:
The Bullish Tri-Star pattern is typically interpreted as follows:
- Strong Bullish Reversal Signal: The pattern suggests a strong shift in market sentiment from bearish to bullish. It indicates that the bears (sellers) may be losing control, and the bulls (buyers) are gaining dominance.
- Market Reversal: The pattern reflects a period of indecision (the second doji candle) followed by a strong bullish move (the third candle). The lower close of the doji indicates that the bears tried to push prices lower but were unable to maintain control.
- Confirmation: The Bullish Tri-Star pattern is considered a robust reversal signal on its own due to its rarity and specific criteria. However, traders may use other technical analysis tools and indicators to enhance their confidence in the bullish reversal.
- Volume Consideration: Some traders also pay attention to trading volume. A Bullish Tri-Star pattern accompanied by higher trading volume can provide additional confirmation of the potential trend reversal.
Caution and Variations:
- The Bullish Tri-Star pattern is a rare occurrence in the markets, and its rarity adds to its significance. However, as with all trading patterns, it’s essential to consider the broader market context, support and resistance levels, and other technical indicators when making trading decisions.
- Traders often use the Bullish Tri-Star pattern in conjunction with other technical analysis tools and strategies to make well-informed trading decisions. While this pattern can indicate a strong bullish reversal, it’s important to manage risk and use appropriate stop-loss orders to protect capital.